Metals often refer to any element that is heavier than Hydrogen and Helium. The main reason is that most metals cannot be produced in the Big Bang Nucleosynthesis (BBN). Normally, Metals are the products of the nucleosynthesis process in stars. However, in the field of Interstellar Medium (ISM), metallicity is always equivalent to oxygen abundance, because oxygen is the most abundant element in the nebulae and most of its ionization stages are easily detectable. Also, oxygen displays strong emission lines in the optical region. Therefore, it is relatively straightforward for astrophysicists to focus on the determination of oxygen abundance to update our understanding of how galaxies interact with the environments, like the circumgalactic medium (CGM), around them.
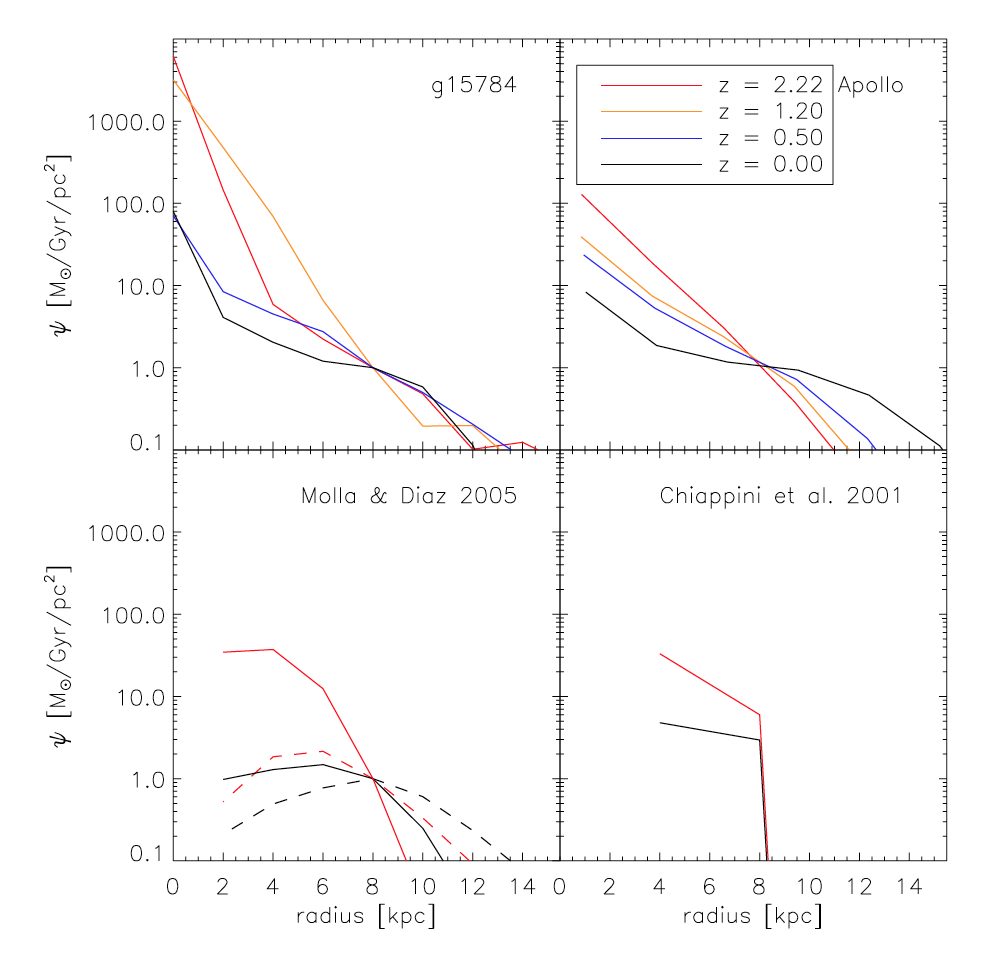
The distribution of chemical abundance is not homogeneous throughout the galaxy. It is expected that galaxies have negative metallicity gradient (e.g. metallicity decreases as galactocentric distance increases) because they are supposed to follow the “inside-out” model (Pilkington et al. 2012). Figure 1 shows the star formation rate per unit surface area as a function of radius for 4 simulated galaxies at different redshifts. It is clear that the star formation rate (SFR) is inversely proportional to the distance away from the nucleus of galaxy. In other words, the gas on the outskirt cannot be transformed into stars as efficiently as the one around the center. Another perspective to understand this negative metallicity gradient is that the timescale 𝞃 of the infall gas (infall rate ∝ exp(-t/𝞃)) is proportional to the distance from the galactic center. Therefore, the gas would accumulate faster in the inner regions of the galaxy. Then, metals are gradually produced in stars and expelled into the ISM through stellar wind and supernovae. In summary, the timescale for gas transforming into stars and metals is relatively short in the nucleus of galaxy. This leads to the fact that metals are more abundant in the galactic center.
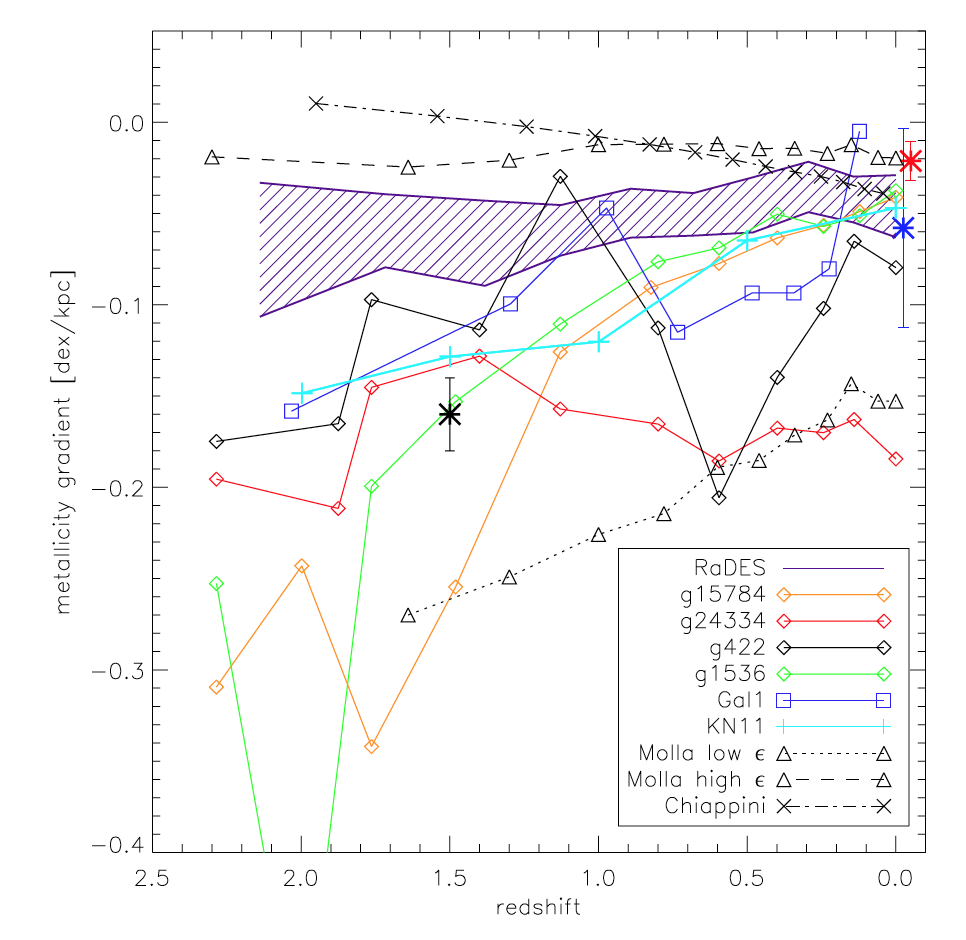
Due to its interaction with the environment (like inflows & outflows), it is not surprising to find that the metallicity gradient evolves over time. In Figure 2, even though different galaxies have distinct underlying treatments of star formation rate and feedback, the general tendency is that the metallicity gradient seems to flatten with time. Here, I want to emphasize the difference between MUGS and RaDES samples.
The simulated galaxies, such as MUGS galaxies, a have relatively higher star formation threshold than the RaDES samples (1 cm-3 vs. 0.1 cm-3). Because the gas is less concentrated/dense on the outskirt, the relatively high star formation threshold can cause the fact that stars are more preferentially formed in the center. Besides this issue, owing to the fact that the ejecta of MUGS galaxies are more localized, its efficiency in distributing the central metals to the larger radii is not as efficient as the RaDES samples. Hence, for the MUGS galaxies, the metal distribution is more centralized, so its metallicity gradient is more negative.
Even if most simulated galaxies tend to flatten their metallicity gradients over time, most of them are still negative. This fact leads to the questions like: “Are there any galaxies with a positive (inverted) metallicity gradient?” or “If we find a galaxy with positive (inverted) metallicity gradient, what is the underlying mechanism that can explain this unusual phenomenon?”.
Astrophysicists actually found some examples. Cresci et al. (2010) found three star-forming galaxies with inverted metallicity gradient around redshift z = 3. Wang et al. (2019) found two dwarf galaxies with positive correlation between metallicity and galactocentric distance around redshift = 2. However, they use completely different explanations to approach this issue.
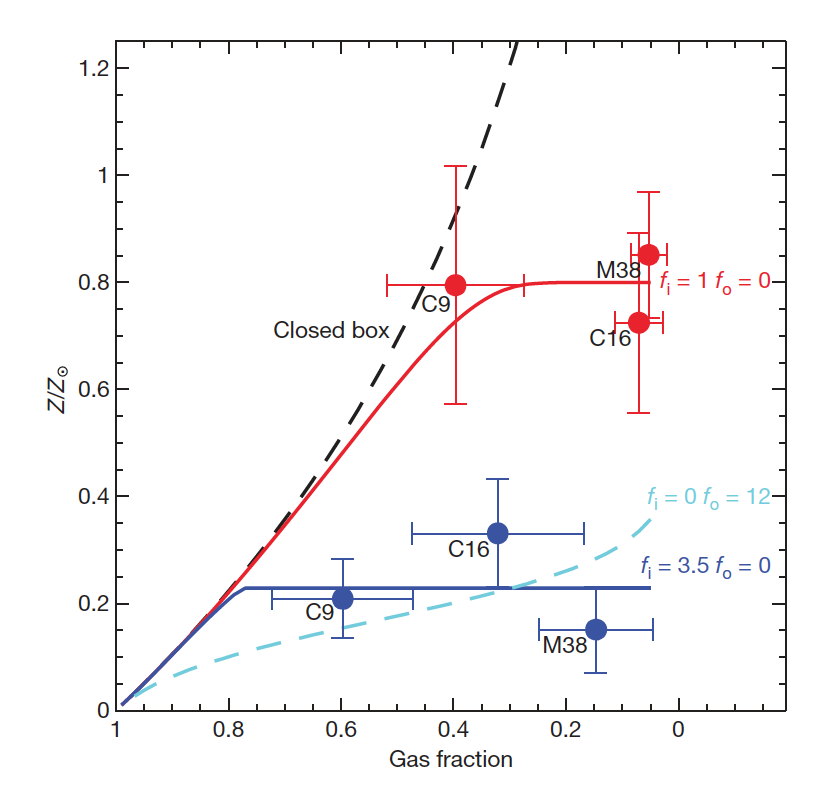
Based on the simple chemical evolution model from Erb (2008), Cresci et al. (2010) implied that the accretion of low-metallicity gas should play a dominant role in diluting the central metallicity of their galaxy samples. They ruled out the possibility that outflows should be dominant using the following logic. Based on equations (11) & (13) from Erb (2008), they first plotted metallicity against gas fraction as the one shown in Figure 3. If the outflow is dominant, they then pointed out that high metallicity regions (red points in Figure 3) could be explained with an outflow rate (fo) roughly two times the SFR. However, an outflow rate ~12 times the SFR was required to explain the location of low metallicity regions (blue points in Figure 3) in the plot, which was unphysical. On the contrary, if inflow is dominant, they only required an inflow rate ~3.5 times the SFR to explain the low-metallicity region. Due to this illustration, they concluded that it was unlikely that outflow could play a dominant role, but they should expect to find massive inflows of low metallicity gases in these three galaxies.
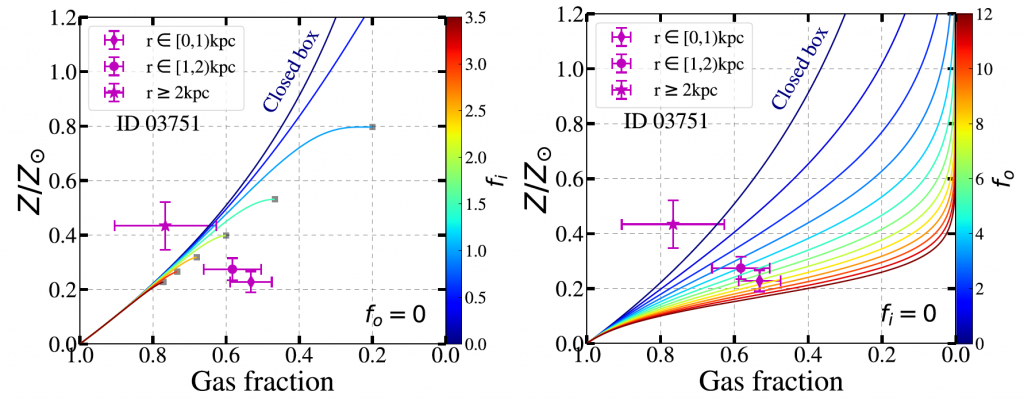
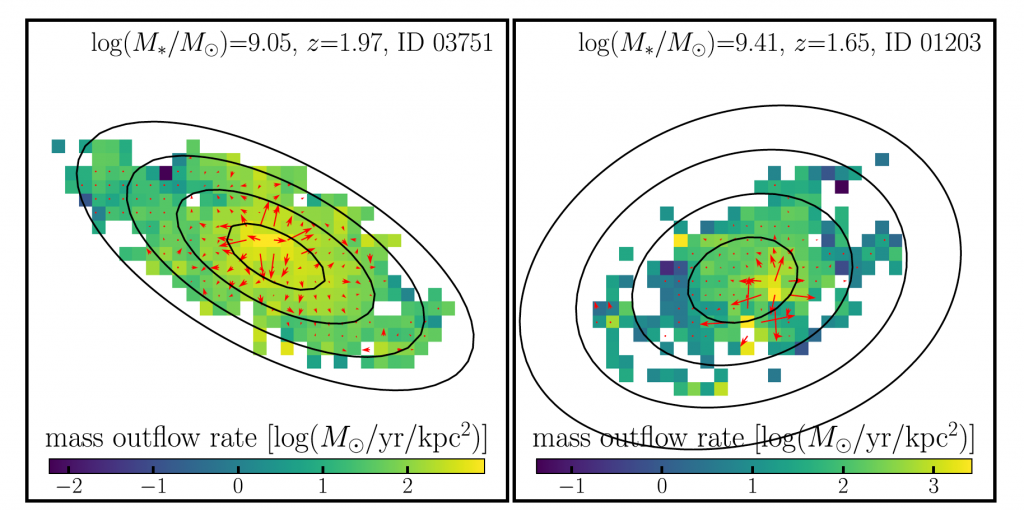
Based on the same model (Erb (2008)), Wang et al. (2019) claimed that outflows (instead of inflows) should play a dominant role. In Figure 4, it is clear that each curve of the inflow model would cease at a certain point in the metallicity-gas fraction plane, which indicated there was a corresponding minimum gas fraction for each inflow rate fi. However, for the regions inside 1 and 2 kpc (the diamond and circle symbols), they actually lied in the “theoretically impossible” regime that the pure-inflow model could not explain why they have such low gas fractions. Instead, the pure-inflow model could cover this regime because there were no constraints for the gas fraction. Following this illustration, they could conclude that the pure accretion of low-metallicity gas was not enough. Instead, these galaxies needed strong outflows to dilute and re-distribute the central metallicity. They also mapped out the gaseous outflow rates throughout the whole galaxy and found out the outflow rate was maximized in the center, which supported their main argument above (Figure 5). A brief summary of simple chemical models and the critical analysis of Cresci et al. (2010) and Wang et al. (2019) will be covered in the following series of this post.
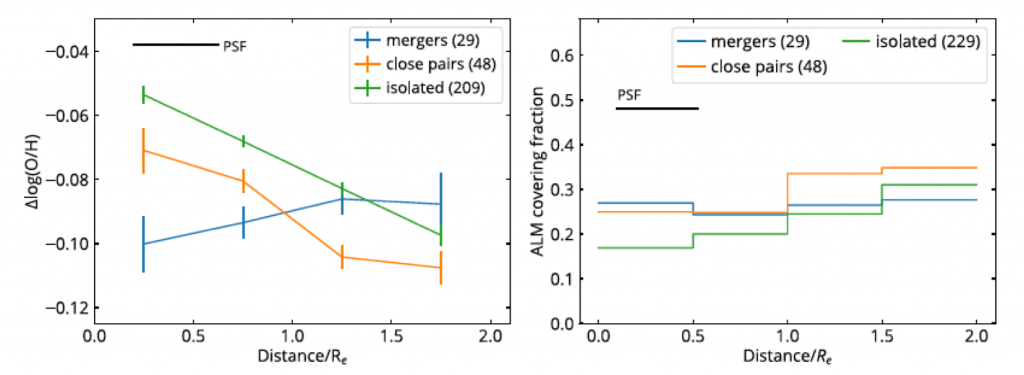
Inflows of low-metallicity gas and strong outflows are not the only reasons that lead to these inverted metallicity regions in galaxies. From the analysis of Anomalously Low-Metallicity (ALM) regions in MaNGA star-forming galaxies, Hwang et al. (2019) pointed out the locations of these ALM regions were closely related to the corresponding interaction stage (mergers, close pairs, and isolated) of each galaxy. In Figure 6, for the merger-type galaxies, the ALM regions were typically found around the nucleus of the galaxies. On the contrary, the isolated galaxies were likely to have lower metallicity in the outer regions. Therefore, metallicity maps might indicate the inflows or accreted gas (having lower metallicity) gradually move from the outer regions to the innermost regions across the interaction history.
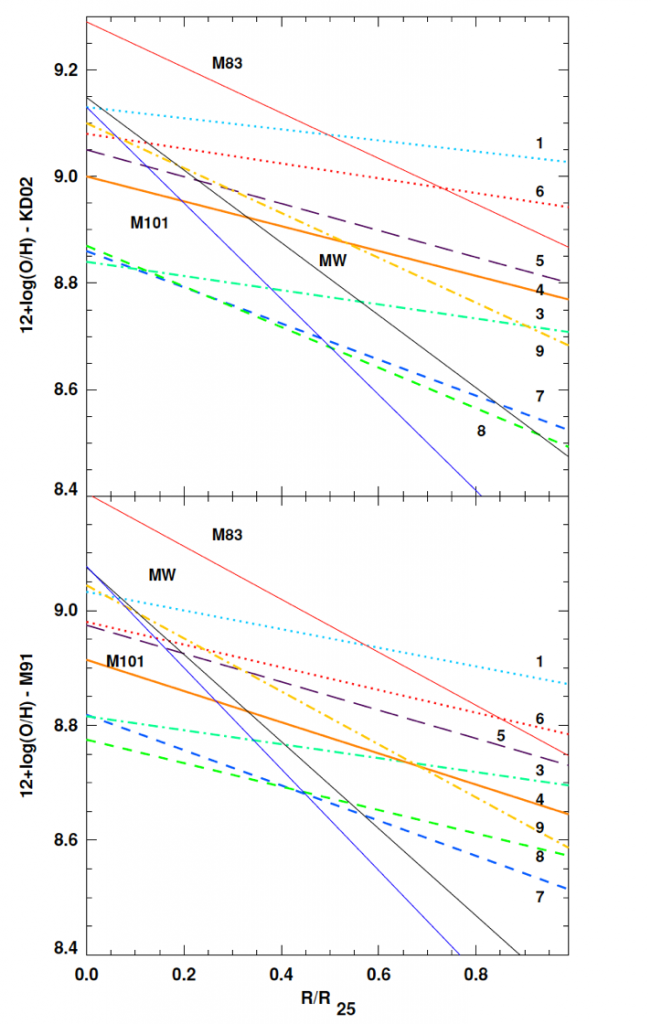
Hwang’s finding was consistent with the result in Kewley et al. (2010). They found the mean gradient in close pairs is -0.25 ± 0.02 compared with a mean gradient of -0.67 ± 0.09 for the isolated spiral galaxies. In Figure 7, the eight close pairs (dash lines) have much flatter metallicity gradients than the 3 isolated spiral galaxies (solid lines). This might lead to the fact that less-enriched gas can probably invert the metallicity gradient in these merger-type galaxies.
In conclusion, this post summarizes the “inside-out” model of galaxy formation and the possible mechanisms of inverted metallicity gradient. In the next post of this series, I will focus on the simple chemical evolution, including closed-box, inflow, and outflow, and illustrate why we have a minimum value of gas fraction for each inflow rate in the pure-inflow model (Figure 4).
Reference
[1] Cresci, G., Mannucci, F., Maiolino, R., et al. 2010, Nature, 467, 811
[2] Erb, D. K. 2008, ApJ, 674, 151
[3] Hwang, H.-C., Barrera-Ballesteros, J. K., Heckman, T. M., et al. 2019, ApJ, 872, 144
[4] Kewley, L. J., Rupke, D., Jabran Zahid, H., Geller, M. J., & Barton, E. J. 2010, ApJ, 721, L48
[5] Pilkington, K., Few, C. G., Gibson, B. K., et al. 2012, A&A, 540, A56
[6] Wang, X., Jones, T. A., Treu, T., et al. 2019, ApJ, 882, 94